 Visualizing external fundraising and donations in universities and research and development institutions
Analysis of external fundraising through ndustry–university collaboration sites
Visualizing external fundraising and donations in universities and research and development institutions
Analysis of external fundraising through ndustry–university collaboration sites
1. Purpose of “visualization”
In the “Guidelines for Enhancing Industry–University Collaboration Activities”(dated November 30th, 2016; hereafter referred to as “Guidelines”), the importance of obtaining personnel costs and the necessary indirect costs was pointed out to achieve full-scale collaborative research. The Survey of industry–university collaboration activity management was conducted to understand how industry–university collaboration sites developed at university campuses, and obtained external funds from private enterprises (FY 2018 results), as a reference for policy-making.

Three years after the enactment of the Guidelines, each site was surveyed on the achievement of genuine large-scale joint research indicated therein, as well as on the importance of covering personnel and indirect costs based on optimal cost allocation.
2. “Visualization” method
2.1. Survey summary
2.1.1. Survey procedure
This survey was conducted according to the following procedures.

2.1.2. Survey subjects
The survey subjects were sites developed under site development projects funded by MEXT and METI, which were led by universities and national research and development institutions, such that both facilities and equipment, or only facilities, were developed. Specifically, the following 52 of 69 sites were developed under these projects (amounts are in project unit budgets).
- ♦MEXT, “International scientific innovation site development project based on industry–university collaboration utilizing local resources” (FY 2012, 50 billion JPY): 15 sites (including 13 survey sites)
- ♦MEXT, “Evidence of local science and technology site development project” (FY 2016, 15 billion JPY): 22 sites (including 16 survey sites)
- ♦METI, “Industrial science and technology research and development facility improvement subsidies (advanced innovation site development project)” (FY 2008–2009, 17.6 billion JPY): 19 sites (including 13 survey sites)
- ♦METI, “Innovation site location support project (technology bridging site improvement project)” (FY 2010, 12 billion JPY): 11 sites (including 8 survey sites)
- ♦METI, “Tohoku Region new industry–university collaboration framework building project” (FY 2011, 1. 5 billion JPY): 1 site (including 1 survey site)
- ♦METI, “Fukushima advance ICT experimental research site development project” (FY 2013, 800 billion JPY): 1 site (including 1 survey site)
Sites that were actual survey subjects are as follows.

2.2. Questionnaire on survey implementation
2.2.1. Survey item review and questionnaire drafting
The purpose of this survey was “to ascertain and analyze the features of external fundraising from private enterprises (FY 2018 results), and ascertain the specific efforts of notable sites.” Survey items were reviewed such that the survey could summarize all sites and ascertain basic information on their external fundraising status and methods in a consistent way.
Refer to the following for the actual questionnaires used.
2.2.2. Survey implementation (questionnaire delivery and collection)
The questionnaires were distributed on July 18th, 2019, with a submission deadline of September 9th. Some institutes did not submit the questionnaires by the deadline, although they received reminders; finally, questionnaires were submitted by all 52 survey subject sites.
2.2.3. Survey implementation system
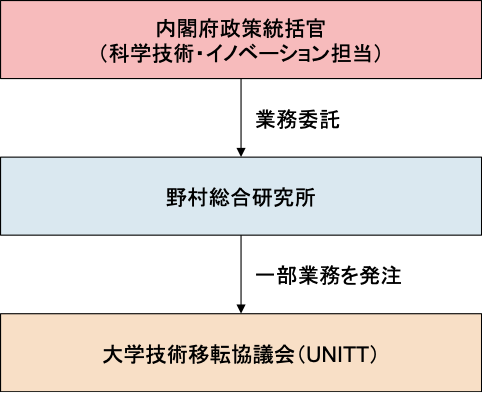
This survey was outsourced to Nomura Research Institute, Ltd. by the director of the Cabinet Office for Science, Technology, and Innovation, with some work conducted by the University Network for Innovation and Technology Transfer.
3. Visualization” results
3.1. Sites targeted for analysis
Out of 52 sites that responded, 43 were found to be institutes based off-campus (as of the end of 2018) that were developing either facilities or both facilities and equipment. The analysis below targeted these 43 sites.

3.2. Funding for joint research with private enterprises per project
30 other sites were conducting joint research at a larger scale overall.
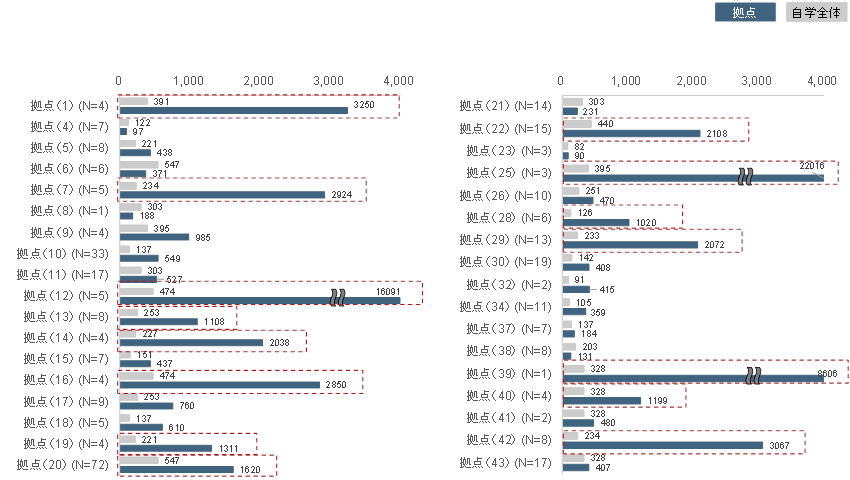
* Site (31) had no data for its institute, so no graph could be prepared. The ‘N’ in parentheses, indicates the number of joint research projects with private enterprises.
* Use responses from each university in MEXT’s “Survey of industry–university collaboration” (FY 2017 results) on “funding for joint research with private enterprises per project for institutes overall” (10,000 JPY).

* Site (31) had no data for its institute, so no graph could be prepared. The ‘N’ in parentheses indicates the number of joint research projects with private enterprises.
* Use responses from each university in MEXT’s “Survey of industry–university collaboration” (FY 2017 results) on “funding for joint research with private enterprises per project for institutes overall” (10,000 JPY).
3.3. Personnel costs covered by joint and consignment research (per joint and consignment research project)
The amount of personnel costs incurred per joint and consignment research project was large at seven sites.

* No institutes responded to the survey items for permanent full-time instructors and researchers.
* The two numerical values within parentheses are the respective numbers for joint research and consignment research projects. The value ‘N’ written on P. 7 is the number of joint research projects with private enterprises, and thus it varies.
3.4. Indirect cost ratio
There are only four sites with indirect costs set higher than the on-campus standards.

* Some values are actual results that reflect the absence of responses for reference values.
3.5. Facility usage revenue
No sites had a high percentage of revenue from facility usage fees per m2 or joint research funding.

3.6. Equipment and service usage revenue
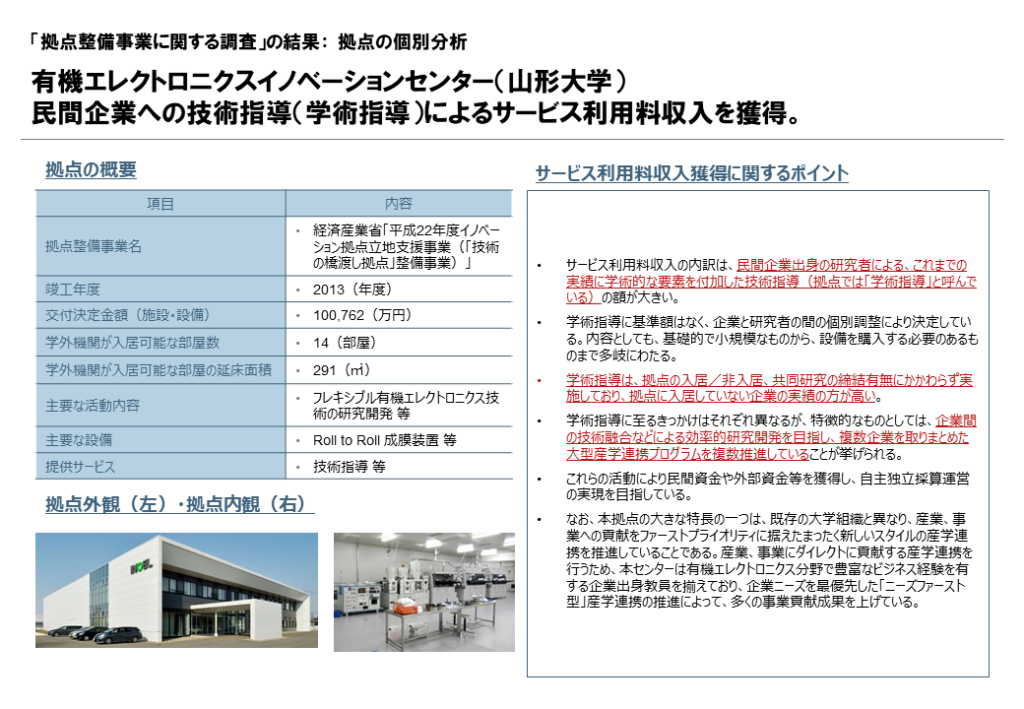
At one site, the equipment and service usage fee revenue per m² and percentage consisting of joint research funding were both at a high level.

3.7.Summary table of external fundraising functions
Some sites were successful in large-scale joint research with private enterprises and external fundraising by other methods; this is shown in a summary table in Chart 11. In addition, hearings were held at sites that made notable efforts, which are summarized below.
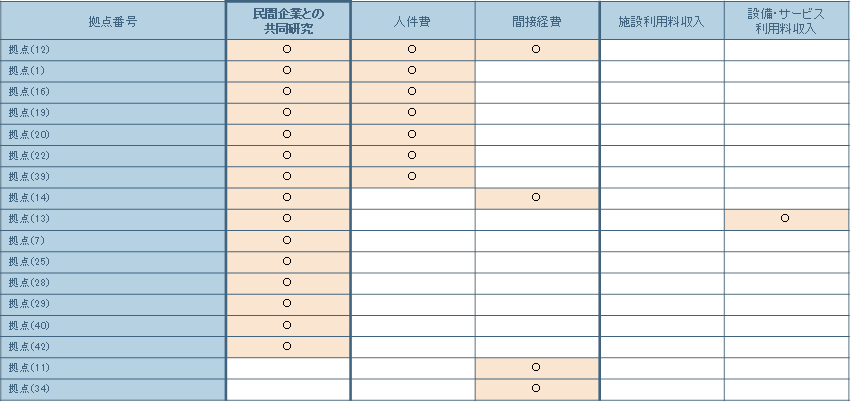
(NOTE) Concept of notation in “Summary table of external fundraising functions”

3.8. Examples of sites making notable efforts
3.8.1. Medical Innovation Center (Kyoto University)

3.8.2. Smart Life Support Innovation Center (Waseda University)

3.8.3. Cooperative Research and Development Center for Advanced Materials (Tohoku University)

3.8.4. Innovation Center for Multi-Business of Nitride Semiconductors (Nagoya Institute of Technology)

3.8.5. Innovation Center for Multi-Business of Nitride Semiconductors (Nagoya Institute of Technology)

3.8.6. Innovation Center for Organic Electronics (Yamagata University)
3.9 References


4. Material
The above reports can be obtained as a pdf file
- トップ
- Visualizing external fundraising and donations in universities and research and development institutions
- Analysis of external fundraising through ndustry–university collaboration sites